
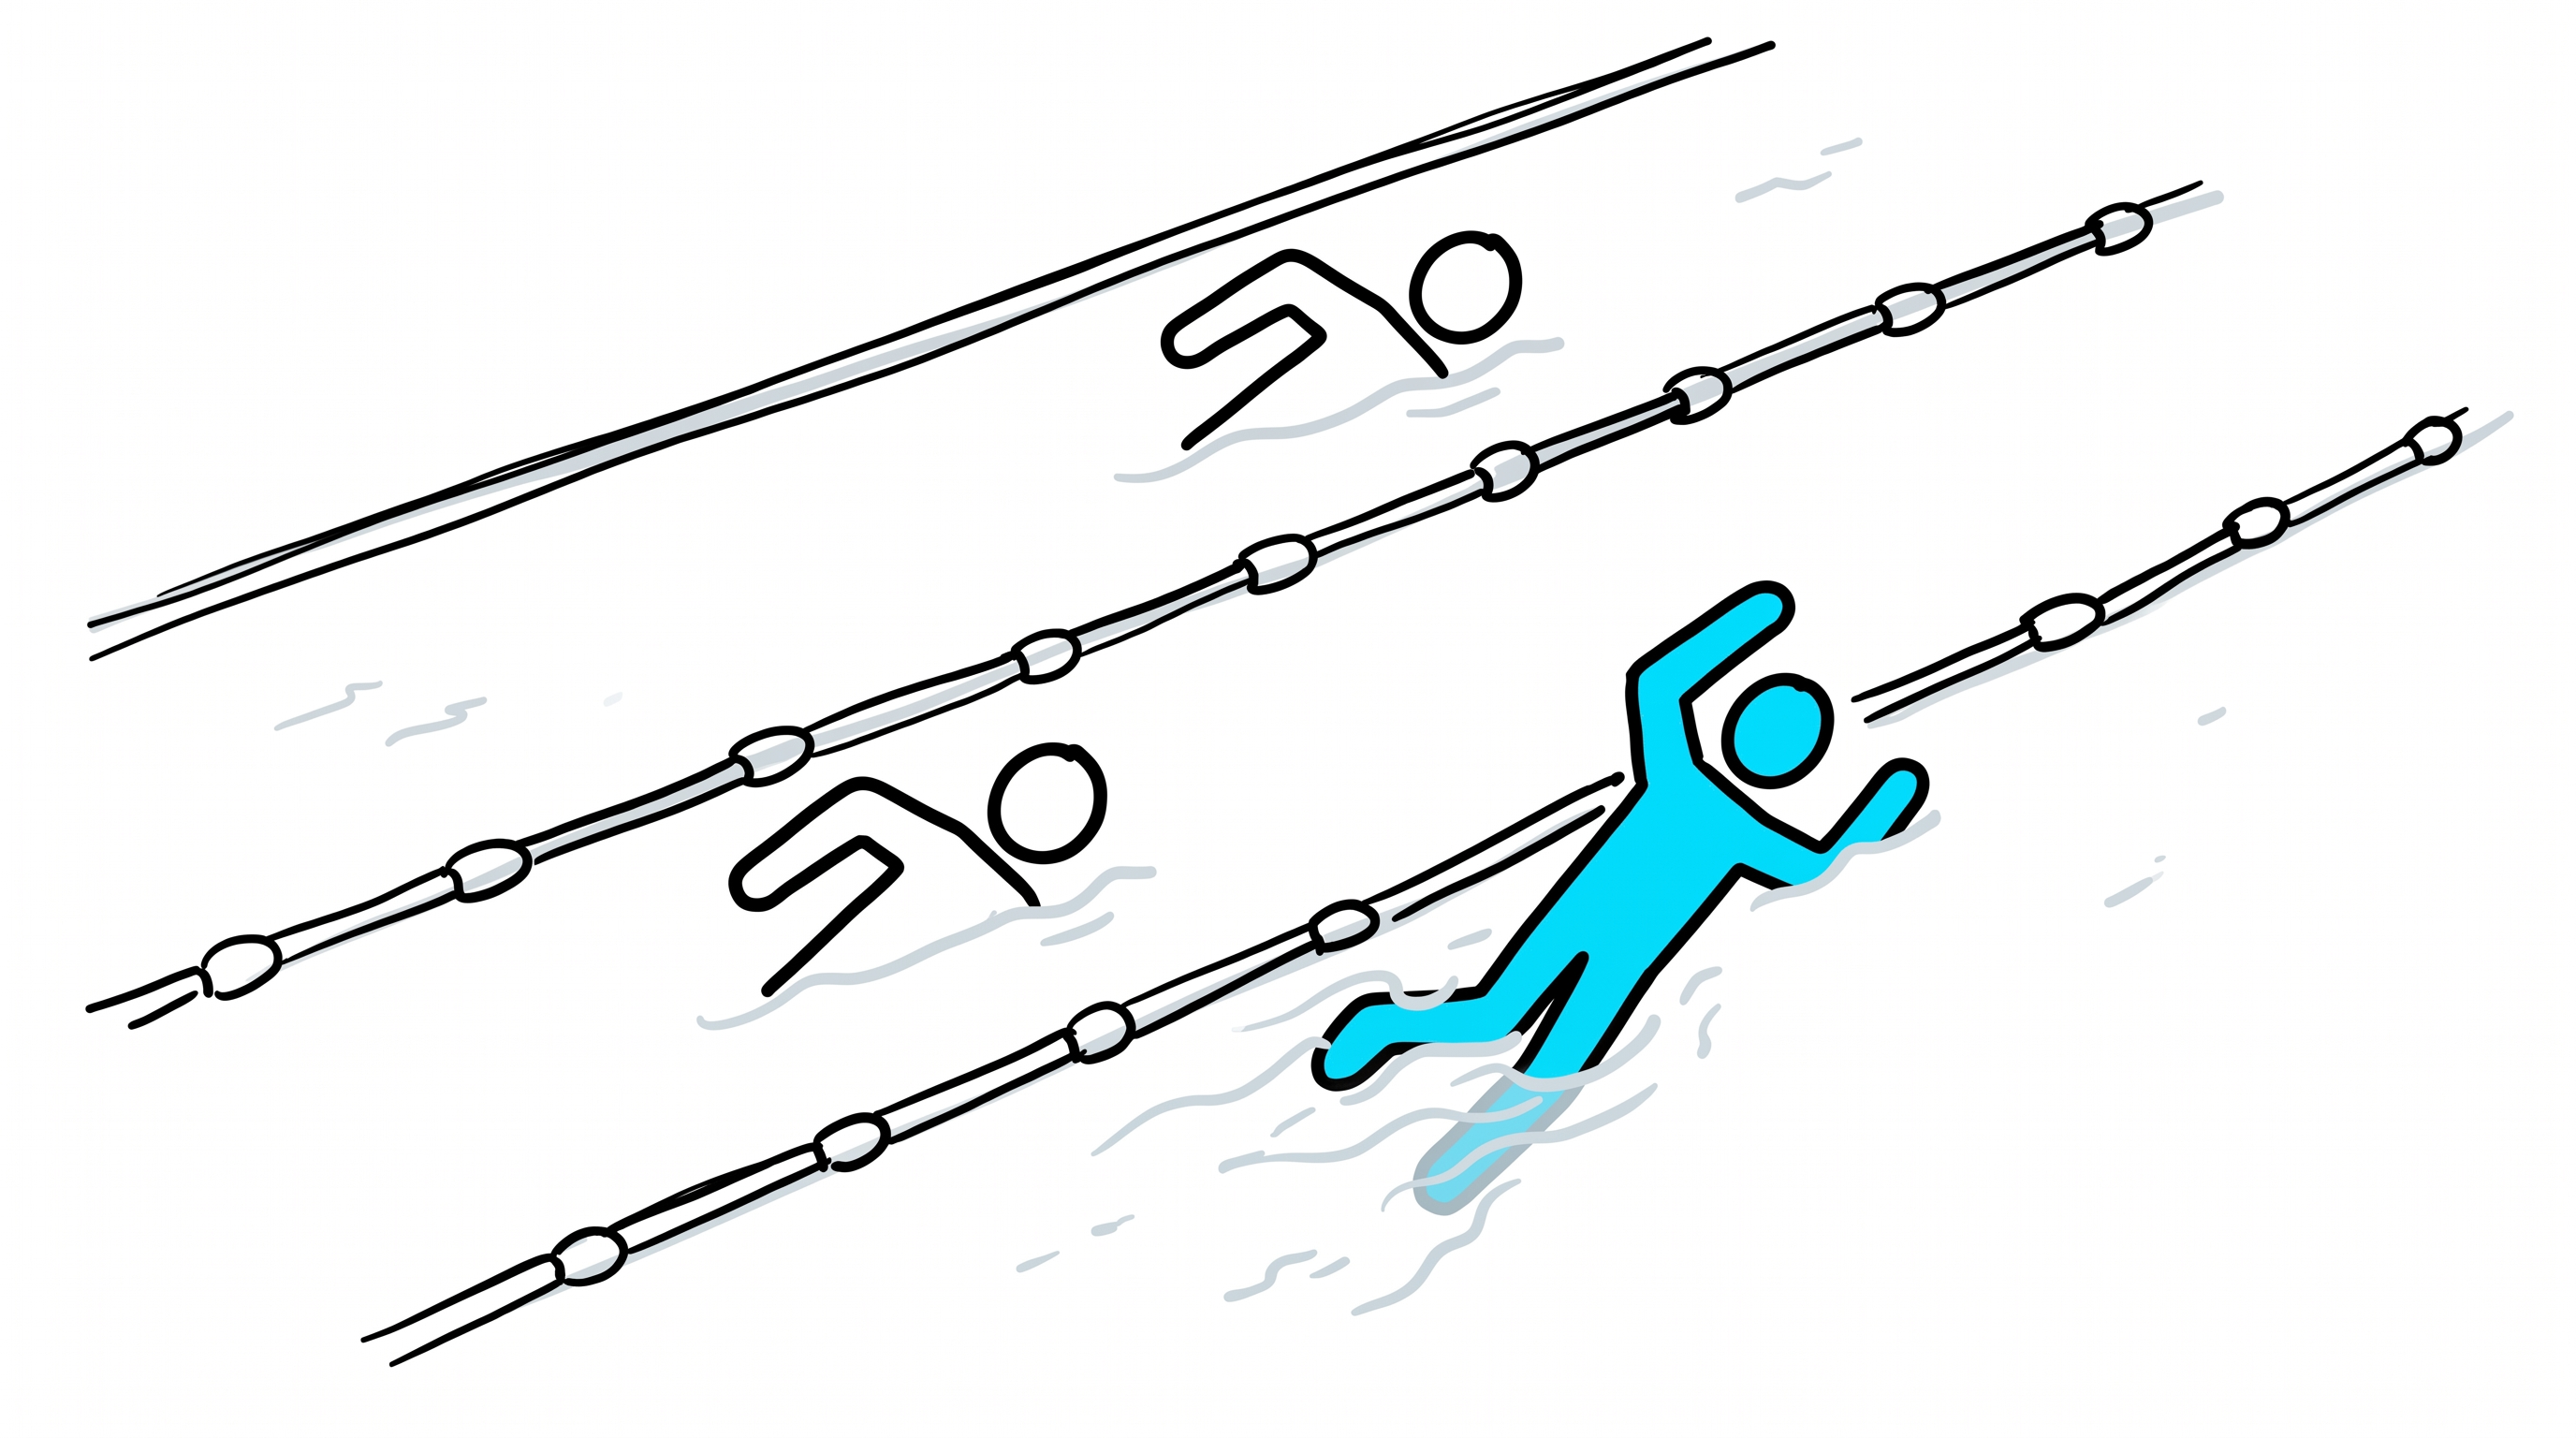
Get Out of Your Swimlane
My last article about forward-deployed black belts triggered several replies from leaders who have spent their careers in operational excellence and Six Sigma. A few cited examples from the black belt toolkit, including process mapping notation, i.e., the literal symbols and rules used to draw how work moves from one step to the next.
One comment on LinkedIn rightly pointed out that Lean and Six Sigma grew up in manufacturing, so the most common workflow-design method "is not well suited to knowledge work/services, and not trivial in its own right."
His verdict on my article about who, exactly, should be leading work redesign efforts? "The hill is even higher than you think."
I almost wrote about process mapping several months ago, based on nostalgia from my Credit Suisse days, but last week's comments finally inspired me to write it. The topic also feels more relevant as my Lead with AI clients deconstruct their most common workflows.
Last week I observed that mainstream AI playbooks say "redesign the work," but often fail to say who does that work. Even fewer explain what the map should look like.
The Workline's slogan is "lead across the lines of modern work." This article is about changing how we draw the actual lines of how work is done.
Logical Love Letter
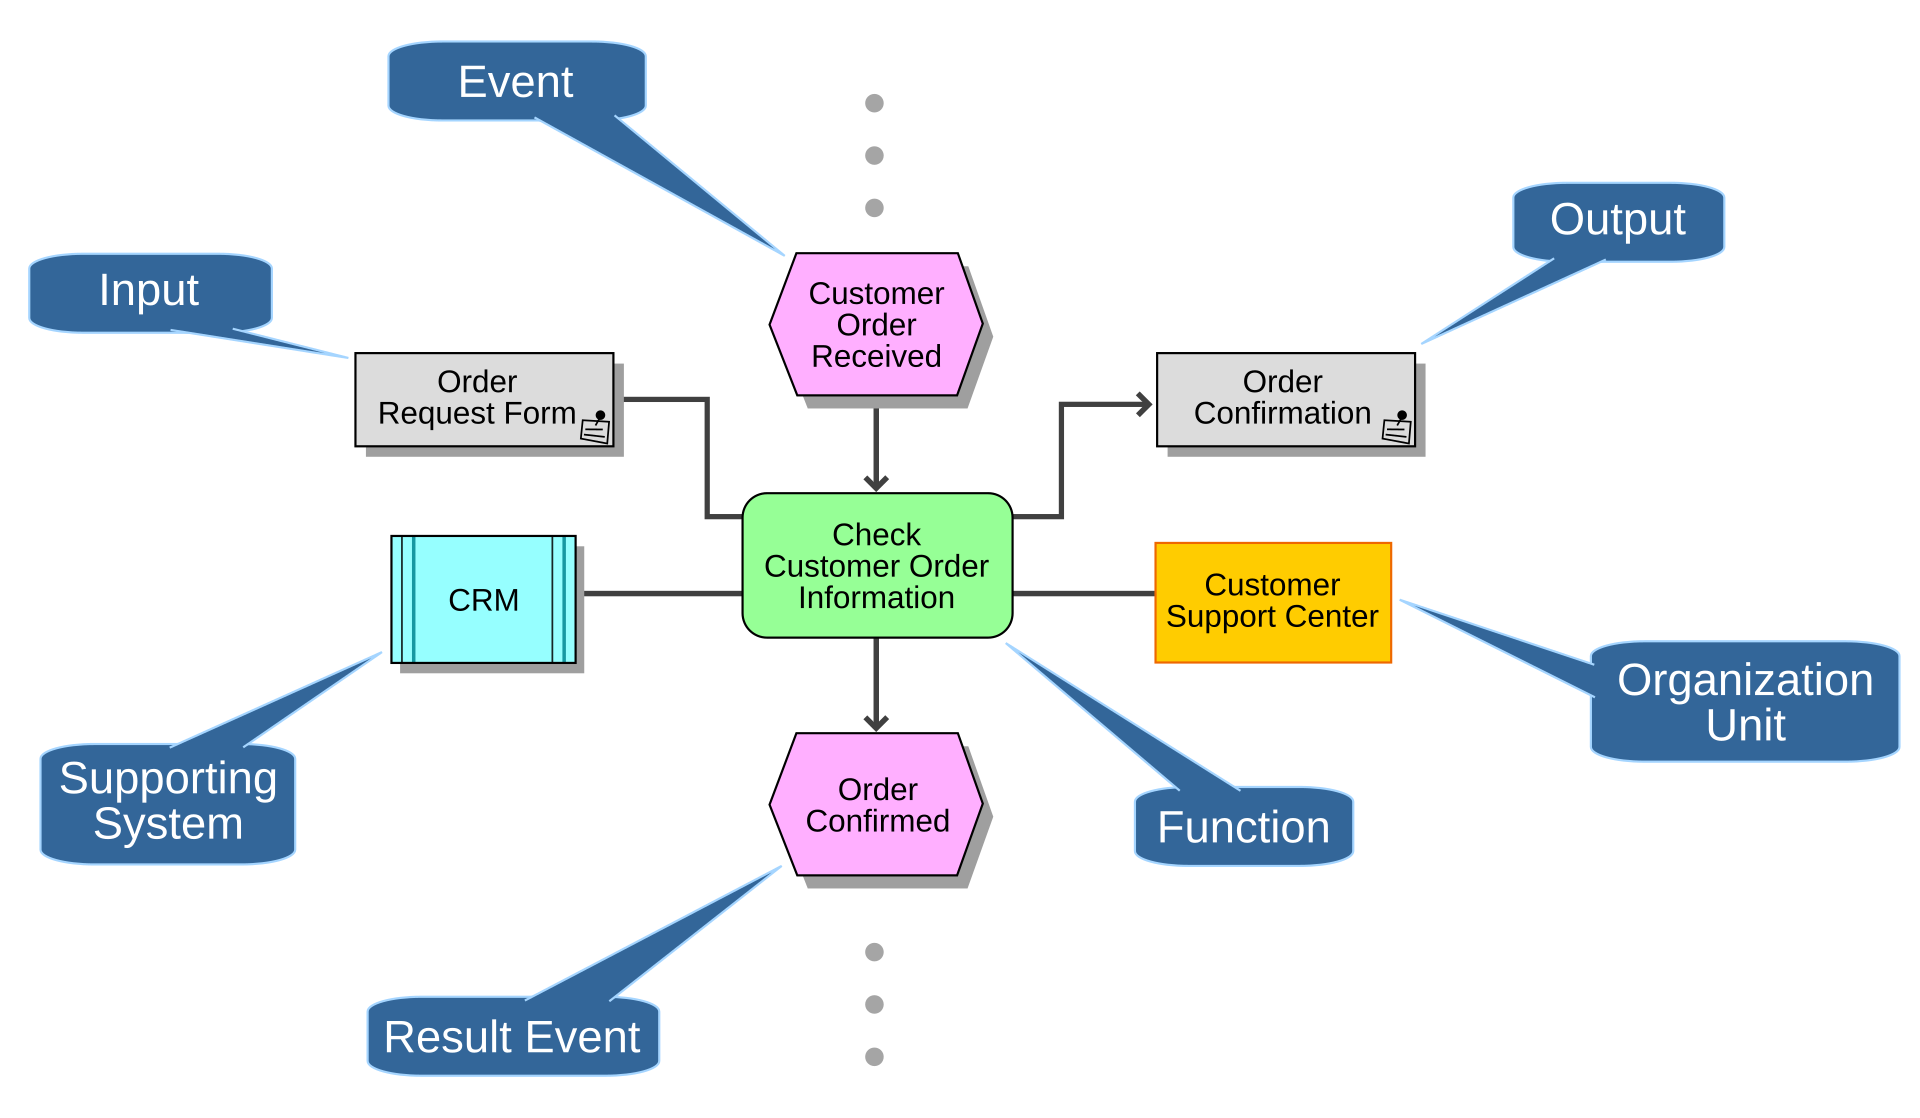
When I was first introduced to Lean and Six Sigma at Credit Suisse, the central operational excellence team was using a modeling tool called ARIS, and a process notation standard called event-driven process chains (EPC). As the name implies, EPC diagrams are bookended by events (something happens), and are otherwise a mix of functions (something is performed) and logic gates to show where work paths split, run in parallel, or come back together.
Here is the simplest EPC diagram example from Wikipedia, where you can see a function bounded by two events with a number of supporting elements (more on them later):
As a natural systems thinker, I liked EPC notation the moment I saw it. Every step was explicit, and diagrams were not strewn across a series of swimlanes from the start.
EPC maps the work before having to argue about who does what.
So Much Swimming
Many years later, I was surprised to find myself reminiscing about EPC notation while surrounded by my human slide-making machine colleagues at McKinsey. Engagements commonly included some kind of "map how things are done today," and I started noticing how quickly the business analysts and associates doing that documentation would rely on swimlanes.
A square for each step, a diamond for a decision, one horizontal band per team...and one big headache trying to read most of them.
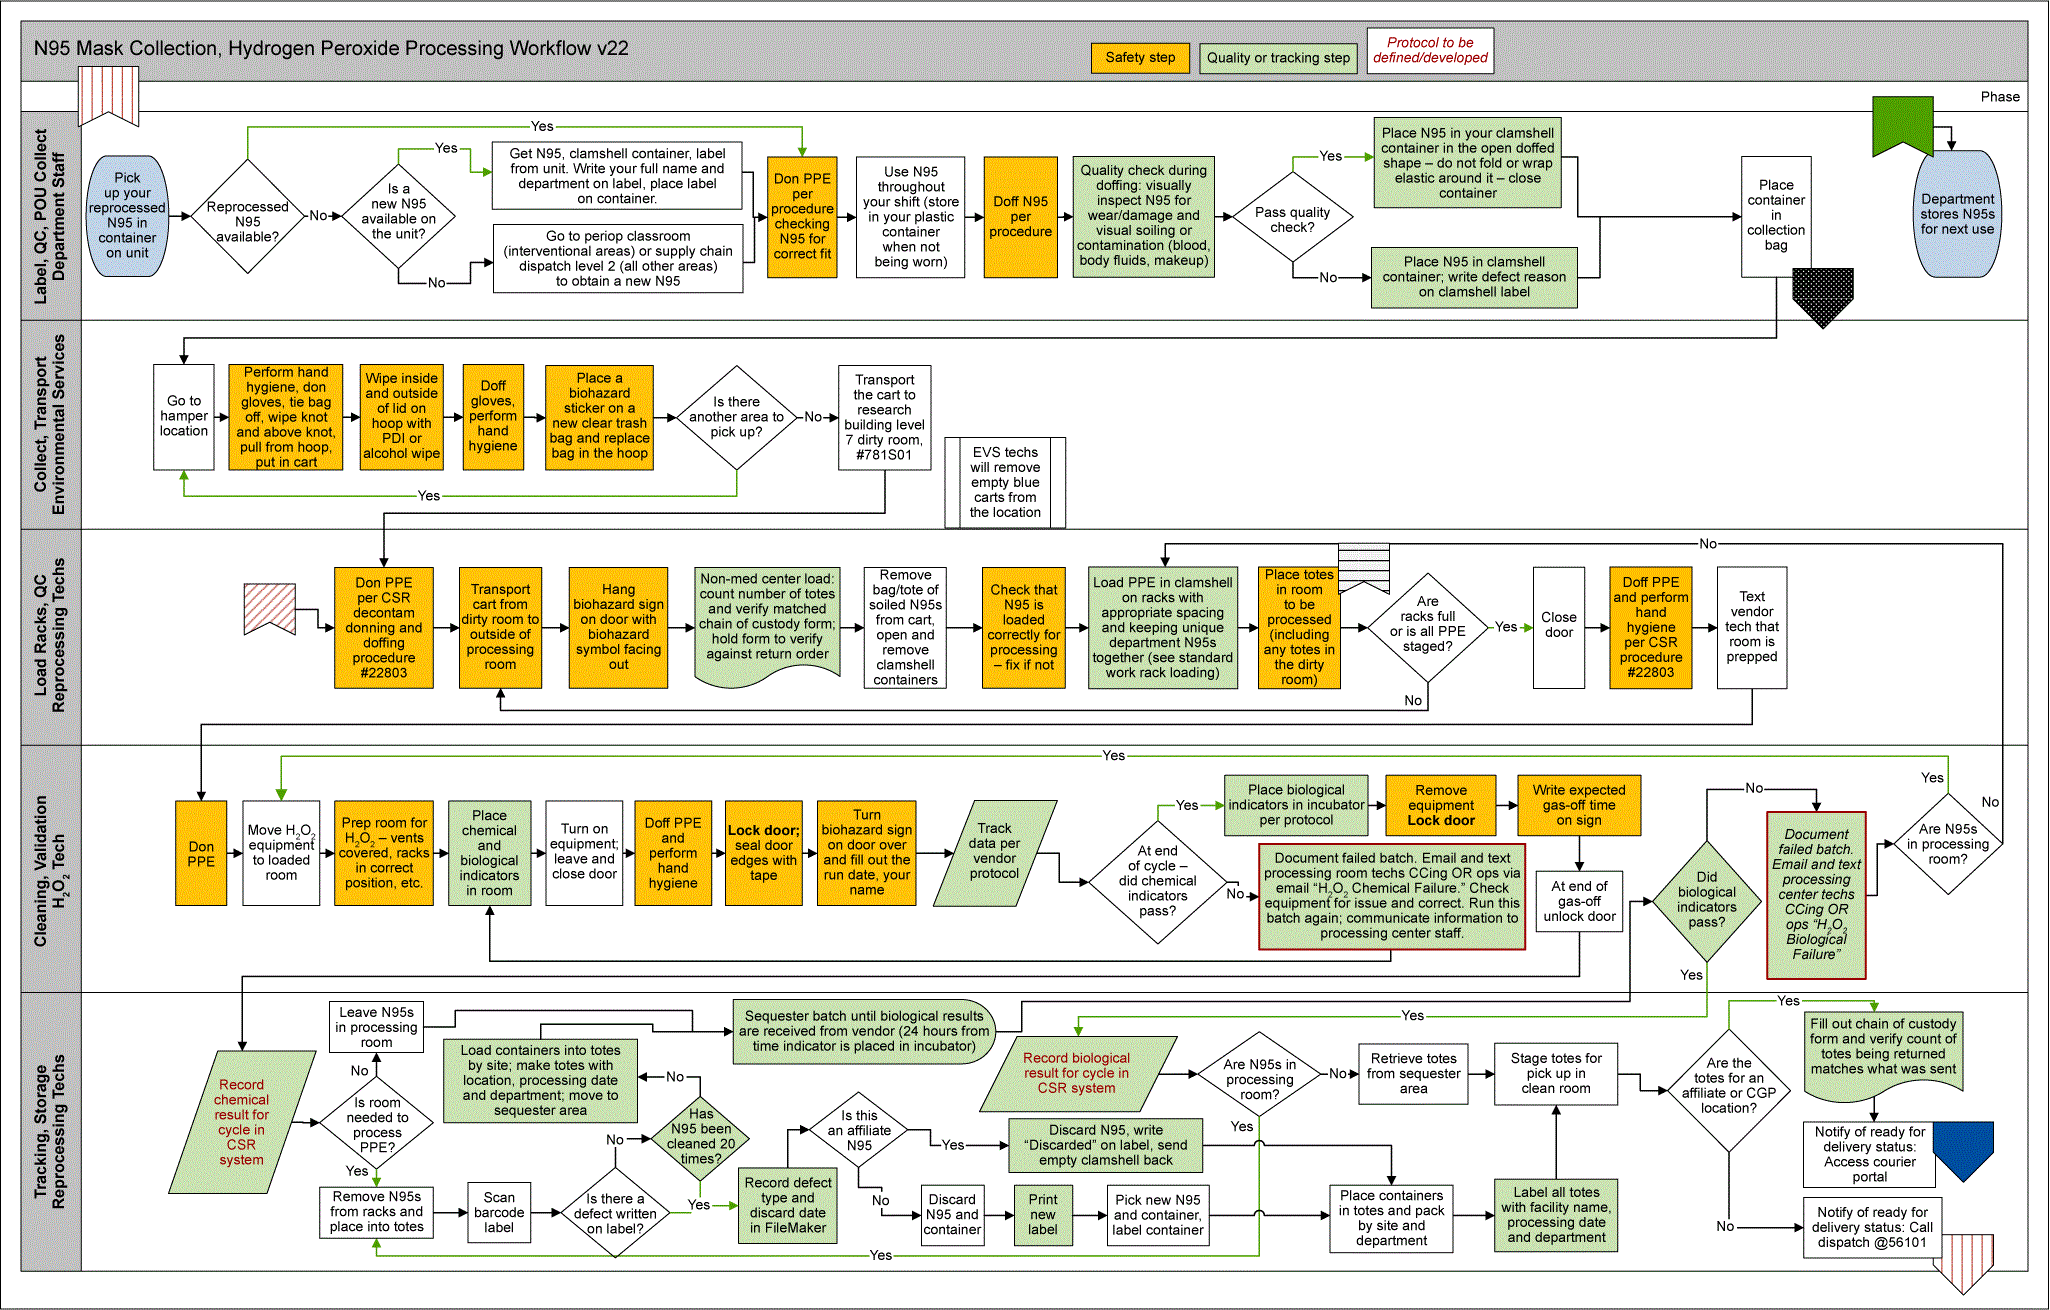
I saw the same debates happen frequently. Which lane does this step belong in? What should this group be called? Should we break the large department into multiple lanes? Every answer meant redrawing the page, and the logic of the process seemed to get less attention than the labels down the left-hand side.
I can't say for sure what process notation (if any) my younger colleagues had been taught. My guess is they reached for swimlanes because our clients, and therefore their consultants, already carried the org chart around in their heads.
The problem is that org charts are highly volatile when AI shows up.
Cut the Lines
When I wrote about a pair of reports on AI crossing organizational boundaries, I shared a brilliant quote from Rishad Tobaccowala:
"AI is like hydrochloric acid that burns through all the containers of the past."
Swimlanes are one of those containers: each lane is a team, drawn as a box around its share of the work.
The person or group (or AI agent) responsible for a given step in a process or workflow obviously still matters, but I believe that prioritizing the "who" from the start is a fool's errand given how quickly AI is changing who does what.
This is where the supporting elements in the Wikipedia example come in. EPC records who performs a step, and what inputs and data are involved, as small objects attached to the function. If an AI agent took over a given step, you simply swap the attachment.
In EPC, the logic stays put, and you never have to redraw the lane lines.
Draw the Work
In my work as a Transformation Partner at Lead with AI, we teach two frameworks to help leaders identify where AI fits:
- GED-RT helps teams pick which tasks are best suited to explore with AI first
- OVER breaks one piece of work into atomic steps where AI's role can be evaluated
GED-RT's own example is the weekly meeting follow-up, which meets all five of its criteria. Here is how that workflow looks in EPC today, with a person doing every step:

And here it is after an AI redesign:

The logic barely moves. Most of the attachments switch from a person to an agent or an automation, and two gates show where the person stays. Commitments with a missing owner or deadline go back to a person to sort out. Nothing gets sent, and the tracker stays untouched, until someone approves it. The agents take the steps that need interpretation, and the people stay where the judgment is.
You can clearly see the human in the loop.
I had AI draw these diagrams from a text description and a couple of revisions, which says something about how cheap the drawing has become. The thinking still costs the same, and the comments I received about my last article had a point about knowledge work: it loops back and wanders off-script, and no notation makes that seamless.
But a map helps once the work is broken into steps small enough to draw.
What Can You Do on Monday?
If last week's article sent you looking for black belts, and you didn't find any, consider EPC diagrams as a gift from the operational excellence toolkit. All it takes is a whiteboard and one workflow your team repeats every week to get started.
- Find one recurring output. Run a few candidates through GED-RT and pick one that scores four or five. Map it from the event that kicks it off to the result it produces, one OVER-sized step at a time, before anyone names an owner. Your AI tool of choice can turn the sketch into a clean diagram in minutes.
- Mark every gate in red. Circle each point where the work splits, waits or needs someone's approval. Those gates show where people might stay in the loop, whatever the agents end up doing.
- Label the "who" last, in pencil. Save OVER's evaluate step for after the logic holds up, then tag each step person, agent or automation. Expect to change those tags as the tools improve.
Swimlanes draw lines around people and organizations, but better maps draw lines between steps.
And those are the lines worth leading across.

If you redrew your team's most common workflow tomorrow, which steps would change hands, and which gates would you insist on keeping? If this resonates with your work, get in touch.